Decoding Bike Data:
What Metrics Matter and Why
 Richard Fries is the Director of Cycling Experience for the Best Buddies Challenges. With more than 40 years experience, he has been a racer, commuter, tourist, promoter, advocate, journalist and commentator on the sport and lifestyle of cycling. Having raced at the professional level both in America and Europe, Fries is well known as a race announcer having called countless USA Cycling National Championships, World Cups, and UCI World Championships. But he is also a tireless advocate having recently served as the executive director of MassBike. You can follow him on Strava to learn more.
With the advent of spinning, indoor cycling and products such as Peloton folks are being exposed to data like never before. While January is a time for those “New Year Resolutioners” in the gyms, who will likely quit within a few months, it’s a great time for riders to get some great indoor training in, and focus on understanding their data.
There is a phrase in business, “If you cannot measure it, you cannot manage it,” and it is somewhat true to exercise physiology. For a lot of people, data helps them break out of a workout stasis. With cycling, all that data gets taken along for adventure outdoors too. At any group ride a rider will encounter a curious lexicon bantered about the parking lot – all while everyone is hovering over devices on their handlebars, pushing buttons and swiping screens – before and after the ride.
“Not bad, 270 normalized,” says one.
“I’m showing 1,500 KiloJoules,” says another.
“I was in Zone 4 that last half hour!” boasts another.
Meanwhile, I’m simply looking at my phone to see if I can get to the supermarket before it closes. The vocabulary can be daunting. Relax.
While I- and most experienced cyclists and top pros – complain that novices devote way too much attention to data and too little attention on simply riding well, the advent of devices that provide critical training data has enabled those weekend cyclists to train with an efficient precision.
People crave metrics that show how their training is paying off. Winter time, when a lot of folks use indoor training, is a good time to learn about these metrics.
Different data matters differently to each person. For example, a beginner can benefit enormously by focusing on cadence, while an experienced rider may hardly ever monitor that number. A heavy person will push a lot more watts than a lighter person. And, heart rate during a ride may not matter as much as heart rate while you sleep.
There is a lot to absorb when it comes to data. Like swimming, it makes sense to start in the shallow end. Below is a list of devices to consider as you develops as a cyclist and a glossary of basic terms to help you get some meaningful metrics, improve your overall fitness and cycling. (It will also help you fit in during those snobby parking lot discussions.)
As a card-carrying curmudgeon, I am somewhat dismissive of the need for any such devices. But as a complete hypocrite, I quickly fall in love with just about every one of the items below and the data they provide. The trick is to find a balance between riding for the love of the ride, and training with a focus on data.
I still stick to my mantra of “Ride More; Train Less.” But the things below CAN make your training better.
Here is a guide based on cost, from the least expensive to the most ridiculous in price, and the return on investment for these assorted means of gathering data. Mind you, this is geared for a beginner or novice rider getting ready for the Best Buddies Challenge. See the sidebar below to get a better understanding of how that data can help you train efficiently.
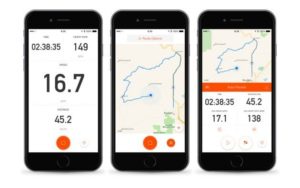
Strava
Cost: Free!
Anybody with a Smartphone or iPhone can simply download this app for free. It will get you about 70 percent of the data you need to analyze your training. Strava uses GPS to record your ride and then posts it on to a social media platform. Through assorted algorithms Strava also records speed, elevation and even provides estimated wattage. It will also give you comparisons on sections or “segments” of your ride with other riders. If you ride with anybody else, or even experience a “Flyby” with riders going in the other direction, Strava can let you know who they are (provided they also use the app). As enthusiasts say, “If it isn’t on Strava, it didn’t happen.”
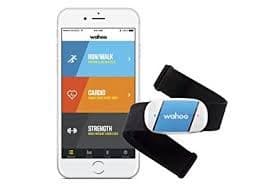
Wahoo Tickr Heart Rate Monitor
Cost: $50
“It’s a bit old-school, but it’s way less expensive than a power meter, they can wear a heart rate strap during any kind of exercise and on all different bikes they might ride (including spin bikes),” said Tim Mitchell, a two-time world champion, exercise physiologist, and director for Team CCB/Velotooler, a UCI pro team. “For most of these people, it’s figuring out what is a sustainable pace, physiologically. Even as they get stronger and can go harder, they will only need to think about maintaining a certain HR number for a given duration.” The feedback of your heart is not as precise as wattage to strategically gauge your exertion during a ride. But it does show key data on your fitness progress.
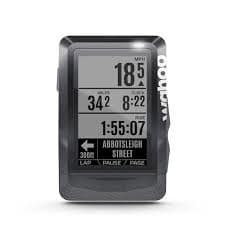
Wahoo Elemnt GPS Cycle Computer
Cost: $330
This is arguably the best bike computer on the market for the money. A rider can get maps, simple turn-by-turn directions, cadence and heart rate displays. The device can show most power sensors that you add later on. See below for my details on why cadence is really good for a beginner or novice rider. Plus, the Wahoo Elemnt display is one of the easiest to read on the market.
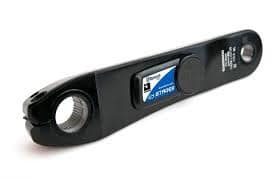
Stages Power Meter
Cost: $579
When you get into power measurement you go into the deep-end of cycling technology. It’s pricey but seductive pool. Let’s start with this piece, the Stages Power Meter, which only measures the power, shown in wattage, put into the left crank arm and sends the signal up to your computer. For most folks with one bike this seems sufficient. You need to get the crank arm that fits on to the bottom bracket (check with your local bike shop, they’ll likely put it on for you). If you are like me and have several bikes, changing this around bike-to-bike can become problematic given the variety of makes of cranks out there. But, it gets you into the game with a quality product.
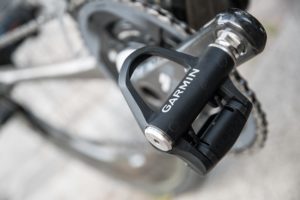
Garmin Vector 3 Pedals
Cost: $999
What you are you paying for here is dual power reading of both legs. And this will surprise even the silkiest of pedalers out there. The other great feature of this is that the pedals are easy to transfer bike to bike, provided you like using the Look pedal and cleat design. While it precludes using mountain bike, touring or cyclo-cross shoes, it does make traveling easy as one can simply install these pedals on any bike you may borrow, or rent.
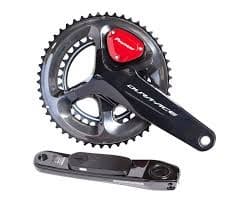
Pioneer SBD-PM91 Shimano Dura-Ace Crankset
Cost: $1,299
So those guys who make great electronics also make what many pros cite as the most accurate and complete power measurement system on the cycling market. The DualLeg analytics blows people away. That’s the good news. The bad news is that it’s a challenge to move it from bike to bike if you have more than one bike. If you already have a crankset you like, however, the Pioneer system can be retro-fitted to your cranks with the unit costing about $799 before installation costs. Also of note is that Campagnolo and less expensive models of Shimano cranks can be used. But fans of SRAM are out of luck for the time being.
What Data Matters?
Now that you have data, does it really matter?
There is a lot of data exercise physiologists love to measure. Some of the most cited numbers are an athlete’s max aerobic capacity or VO2 and the lactate threshold, which is another ceiling of performance. But gaining those numbers can involve hoses and lab equipment and drawing blood.
We’re not doing that. So the numbers most often talked about by athletes themselves are those that they can gather with devices available to consumers.
The numbers below are key pieces of data that will help any beginner improve their cycling. As I did with equipment above, I list these in order of absorption into your regimen. This is designed not for an Olympic athlete, but a beginner simply looking use cycling as a means of improving their health. Note: gaining each successive piece of data requires a bit more equipment that is more expensive as you go.
Cadence. For a beginner and novice cyclist, cadence is a valuable metric. I constantly have to point out that a beginner is spinning too fast (I call them ostriches) or too slow (I call them cows). The key here is to learn how to shift gears to keep you in the accepted sweet spot of 80 to 110 RPMs on flat or rolling terrain. This is what the French refer to as souplesse, riding with a fluid elegance. Experienced riders rarely monitor cadence because they have mastered the art of variable leg speed within that range.
Heart Rate. Heart rate monitors became available to consumers in the 1980s and laid the foundation for zone based training between Zones 1, super easy, and Zones 5, being as hard as one can possibly go for about 30 seconds. For riders in poor condition getting started, heart rate monitors can help you safely push, but also recognize key barriers. There are loads of articles written about ways to train in different zones and what heart rate can tell you. Heart rate really tells you what is going on with your body, good and/or bad. There are three key things I look for in heart rate: resting heart rate taken first thing in the morning; maximum heart rate during a hard interval; and then the time it takes to recover from a hard effort.
Wattage. This simply measures the electrical output, or power, you are generating. Whereas heart rate can vary wildly, watching your power output can let you precisely ride within a desired training program and prevent one from popping like a fuse. Simply riding with power proves interesting enough. You must establish your “Functional Threshold Power” (known in the parking lot parlance as FTP) to develop effective training programs. This is the measure of what you can maintain for an hour, a threshold at which you can function. The common way to do this is to warm up, and then ride as hard as you can for 20 minutes. Afterwards, you simply take the average power output and that is pretty close to the FTP. Once you know your FTP you can train at different levels, gauging that initial output. With a few months riding, you can typically ride at 80 percent of FTP for several hours.
Watts/Kilo. This is the magic number: your FTP divided by your weight in kilograms. And it’s the number that changes as you improve. A 110-pound female rider may produce low watts compared to a 250-pound man. But, divide that number by their weight and they have a measurement that applies to every rider. To say that 250-pound man puts out 250 watts is great, but his watts per kilo is only 2.2, and that 110-pound female rider putting out only 175 watts has a number of 3.6. When they hit a climb, she’s likely leaving him behind. What is great about this measurement is as we train and increase our power, we also decrease our weight. The average “casual” rider at 160 pounds will put out about 2.5 watts per kilo. By comparison, a Tour de France pro at can maintain 490 watts and watts per kilo of 7. This may not amaze you in writing, but see it on the road and you’ll be stunned.

